Dead-Letter Queue Monitoring with Azure Functions
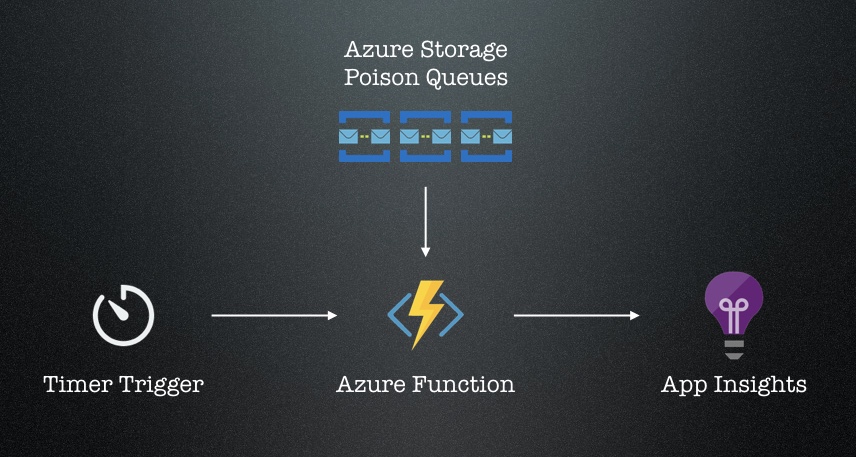
Some time ago I posted an article about how to monitor poison queues of Azure Storage. Recently I created a similar solution for Azure Service Bus queues which I would like to share here in this post.
(Hint: If you want to do this the “short way” you can simply take the “built-in” metric from Azure Service Bus in Azure Monitor (thanks @TomKerkhove for pointing me to that). But if you like Azure Functions like me, go ahead for the solution below…)
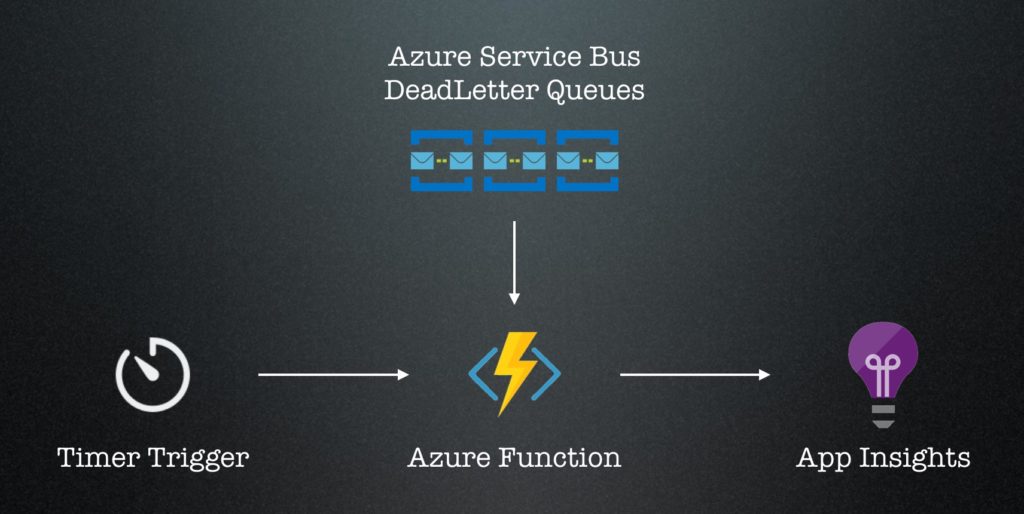
Solution Architecture
The basic idea is having a timer triggered Azure Function that “scans” for dead-letter queues in the Azure Service Bus Namespace and checking the item count in the dead-letter queues. This count is than written as a metric to Application Insights where this values can be monitored and even alerts created on.
How to set up
Setting up the whole solution is pretty easy and can be done within 30 minutes at all. In case you want to use an existing instance of Application Insights to track the metrics in, just pick up the instrumentation key and configure it later in your function settings (see below). Otherwise create a new App Insights instance and pick that instrumentation key.
You can either create a new Azure Function App in Azure or use an existing one (as in my case).
The code for the function may look like this (in case you use the pre-compiled functions template in Visual Studio)

Source code available as gist.
(Attention : The statement await managementClient.GetQueuesAsync(); only lists the first 100 queues in the namespace. In case you have more queues in your namespaces you have to build a loop to simulate a paging (with the optional parameters of the function GetQueuesAsync(). )
In order to get the function running we need to set up some environment variables in Azure:
- The APPINSIGHTS_INSTRUMENTATIONKEY contains the instrumentation key of your App Insights instance you want to track the metrics on
- The MonitorServiceBusQueues settings has the connectionstring to the Azure Service Bus Namespace which contains the queues to be monitored. (You need to give “Manage” permissions)
You can adjust the timer value for your needs in the function code:
[TimerTrigger(“0 */1 * * * *”)] (means every 1 minute)
Depending on your needs to have a more or less fine grained monitoring result set the value higher or lower.
Creating alerts in Application Insights
There is a pretty simple way to get automatic notification when there are items in your poison queues. You can even start an external process like an Azure Function (via WebHook) or start an instance of a Logic App. All done by AppInsights Alerts.
- Navigate in the Azure Portal to the ApplicationInsights instance where the metrics are stored in.
- Navigate to “Alerts” on the menu.
- Click on “Add metric alert” on the right side.

- Enter the information about the
– Alert name and description.
– Subscription and Resource.
– Metric and condition.
– Threshold and period
– and the notification options. - Done. Your alert is now active and fires when on of your poison queues raised the item threshold.
![]()